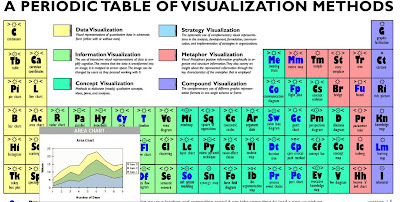
I'm fascinated by data visualization and here is a fun little widget - the periodic chart of visualization methods. Make sure and pass your mouse over each cell to see the example graphic popup.
database performance, sql tuning and data visualization
I'll take Ct thank - something I can understand with any luck....nice periodic table Kyle...it's just amazing how many ways there are to visually represent data or ideas and turn it into something meaningful.
ReplyDeleteI wonder if we're so well suited to visual input simply because we learn to visually identify before we learn anything else ?