SELECT
a0.af1,
a0.af2,
a0.af3,
c.af4,
e.ef1,
FROM
a a0,
(
SELECT a1.af5, a1.af6, a1.af1, a1.af2
FROM
a a1,
( SELECT
   a2.af1,
   a2.af2,
   NVL (a2.af7, 0)
FROM a a2
WHERE
   a2.af6 = 'Z' AND
   a2.af5 >= ADD_MONTHS ((SELECT MAX (af5)
                           FROM  b b0
                           WHERE
                                 b0.af6 = 'Z' AND
                                 b0.bf2 <> '2'),
                          - 11)
GROUP BY
   a2.af1,
   a2.af2,
   NVL (a2.af7, 0)
HAVING COUNT (*) = 12
) sub1
WHERE
a1.af5 = (SELECT MAX (b1.af5)
        FROM  b b1
        WHERE
            b1.af6 = 'Z' AND
            b1.bf2 <> '2') AND
a1.af6 = 'Z' AND
a1.af1 = sub1.af1 (+) AND
a1.af2 = sub1.af2 (+)
UNION
SELECT a3.af5, a3.af6, a3.af1, a3.af2
FROM  a a3
WHERE
a3.af5 = TO_DATE ('02/10/2010', 'dd/mm/yyyy') AND
a3.af6 = TRIM ('X') AND
a3.af10 = '1' AND
a3.af8 - NVL (a3.af9, 0) > 0 AND
NOT EXISTS (SELECT *
           FROM a a4
           WHERE
               a4.af6 = 'Z' AND
               a4.af5 = (SELECT MAX (b2.af5)
                          FROM b b2
                          WHERE
                              b2.af6 = 'Z' AND
                              b2.bf2 <> '2') AND
               a3.af1 = a4.af1 AND
               a3.af2 = a4.af2)
)
subquery,
c c0,
d d0,
e e0
WHERE
a0.af5 = TO_DATE ('02/10/2008', 'dd/mm/yyyy') AND
a0.af6 = TRIM ('X') AND
a0.af8 - NVL (a0.af9, 0) > 0 AND
a0.af10 = '1' AND
a0.af1 = subquery.af1 AND
a0.af2 = subquery.af2 AND
a0.af5 = c0.af5 AND
a0.af6 = c0.af6 AND
a0.af1 = c0.af1 AND
a0.af2 = c0.af2 AND
a0.af5 = d0.af5 AND
a0.af6 = d0.af6 AND
a0.rvv_cd = d0.rvv_cd AND
c0.af4 = d0.af4 AND
c0.cmc_spdc_cd = d0.cmc_spdc_cd AND
(d0.foo = 0 OR d0.foo IS NULL) AND
a0.af5 = e0.af5 AND
a0.af6 = e0.af6 AND
a0.rvv_cd = e0.rvv_cd AND
c.af4 = e0.af4 AND
c.cmc_spdc_cd = e0.cmc_spdc_cd AND
(e0.foo = 0 OR e0.foo IS NULL)
ORDER BY
a0.af1,
a0.af2,
e0.ef1;
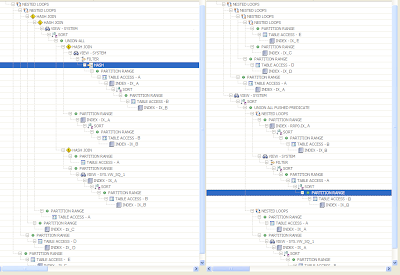
For this query, the default execution plan took more than a day ( I don't actually know how long because I stopped it). After tuning the query using Visual SQL Tuning, the tuned plan took 30 seconds. Here are the two plans side by side:
Comparing these plans if often frustrating, difficult and time consuming and the above plans don't even display all the information required to understand them.
The plans require more information in order to diagnose the SQL that generated them. For example the table alias (and/or query block names) are required since the same table is used multiple times in the query. The table alias's are available with display_cursor() starting in 10g. With display_cursor, we could get the table alias in the "Query Block Name / Object Alias" section below the explain plan. The alias names would still require corellating these lines with the explain plan. How long would it take to understand the query and understand why one plan is better than the other?
There is a better way. That way is Visual SQL Tuning (VST), which DB Optimizer provides.
If we take the query and build a join plan (similar to what the optimizer in Oracle works out in the kernel) we get
The subquery looks pretty complicated but it can be simplified for the purposes of tuning. We can drop out all the references (3 of them) to table "B" because these are un-correlated subqueries that return simply a max() value which is used as a predicate filter for table A (in a1,a2 and a4). Leaving out references to B the diagram looks like
The subquery is actually pretty simple - it's just a union of two table joins (since it's a union it can't, at this point in time, be merged into the main query). Simplifying the diagram further by rolling up the subquery looks like
I've also added the bright yellow highlighted numbers. These are the "filter ratios" , ie the amount of the table that is returned after applying the predicate filters to the tables. Each table that has a predicate filter is marked with a green "F" in DB Optimizer. With this information we can reliably say what the best execution path should be. The Execution path should start at the most restrictive predicate filter, which is "0.006" on table A. This is where the query should start in order to minimize the "running row count", ie the number of rows we have to carry with us through the rest of the joins until we finish the query. After starting with table A, the next safest step is to the table with a master detail connection, table C, because the result set of A to C is guaranteed to be to be no bigger than the rows in C where as the other joins, which are many to many, can return at worst N rows * M rows where N and M are the row counts in the two tables with the many to many join. (the maximum amount of rows returned, I believe is (N*M/(min(ndv(N),ndv(M)) )
Armed with this information we can quickly see that the default plan chosen by Oracle is off:
Oracle doesn't start at the most selective predicate filter ratio and doesn't even get to it until the 4th join. Adding a hint to follow the following order finishes in 30 seconds:
The above plan was obtained with a simple ORDERED hint with table A positioned as the first table. One great benefit of using join diagrams and overlaying the join diagram with the join order, allows us to easily compare side by side the two explain plans:
If more information is wanted, then things such as "NL" and "HJ" for nested loops and hash joins can be added as well as "i" and "fts" for index access and full table scan:
DB Optimizer generates the join diagram. Though future release functionality can not be guaranteed, we are currently working on displaying the filter ratio on the VST diagram, and it is my goal to also display the join order on the join diagram.
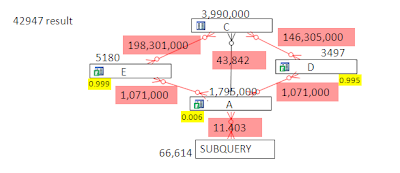
Some other things that would be cool, would be dividing and conquering the query by running parts of the query. For example, in the diagram below I display the result set sizes of just joining two tables at a time (along with their predicate filters):
It's clear that a join between E and C or D and C is fatal to the query optimization. Both many to many joins actually return more rows than even exist in either of the joining tables!
One cool thing is that with the VST diagram, the row counts aren't needed, only the join types and the filter ratios, in order to determine the best execution plan


No comments:
Post a Comment